Assignment 3
Guidelines
You will submit your homework as an R Markdown (.Rmd) file by committing to your git repository and pushing to GitLab. We will knit this file to produce the .html output file (you do not need to submit the .html, but you should make sure that it can be produced successfully).
We will review both your .Rmd file and the .html file. To receive full credit:
You must submit your
.Rmdfile on time. It must be named exactly as specified, and it must knit without errors to produce a.htmlfile.The
.htmlfile should read as a well written report, with all results and graphs supported by text explaining what they are and, when appropriate, what conclusions can be drawn. Your report should not contain any extraneous material, such as leftovers from a template.The R code in your
.Rmdfile must be clear, readable, and follow the coding standards.The text in your
.Rmdfile must be readable and use R markdown properly, as shown in the class template file.
Create a new folder called HW3 in your repository. Use exactly this spelling with upper case letters. You can do this in the RStudio IDE, with R’s dir.create function, or using a shell.
In this folder, create a new Rmarkdown file called hw3.Rmd. Again use exactly this spelling. RStudio will give you a template, or you can use the one available here. Commit your new file to your repository. (If you are using git in a shell you will need to use git add before git commit).
In this file present your answers to the following problems. Your presentation should follow the pattern and guidelines in the class template file.
1. Choosing Between Faceting and Color
Consider the plot faceted on class produced by
library(ggplot2)
ggplot(mpg, aes(x = displ, y = cty)) +
    geom_point() +
    facet_wrap(~ class, nrow = 2)
What are the advantages to using faceting instead of the color aesthetic? What are the disadvantages? How might the balance change if you had a larger dataset?
2. Faceting with Muted Full Data
Sometimes faceted plots can be improved by showing a muted version of the full data in the background. Try this for the setting of the previous problem, show the result, and comment on the effectiveness in this case.
3. Gun Murders in US States
A data set on gun murders within US states during 2012 is available in a CSV file at
In your .Rmd file include a hidden code chunk that downloads this file to your repository if it isn’t there already. There is an example in the notes that shows how to do this. Add the name of the downloaded file to your .gitignore file so it doesn’t show up in the GIT panel.
The variables in the data set are:
state: US state;abb: Abbreviation of US state;region: Geographical US region;population: State population;total: Number of gun murders in state.
Read in the data and create a scatter plot of the number of murders (vertical axis) against population (horizontal axis). Map color to region, and use log scales for both axes. Show the resulting plot and comment on any features that you see.
4. Comparing Some Visualizations
Vehicles in the mpg data set have different numbers of cylinders in their engines. The following table shows the number of vehicles in the data for each cylinder count.
| Cylinders | n |
|---|---|
| Four | 81 |
| Five | 4 |
| Six | 79 |
| Eight | 70 |
Consider these three visualizations of these numbers.
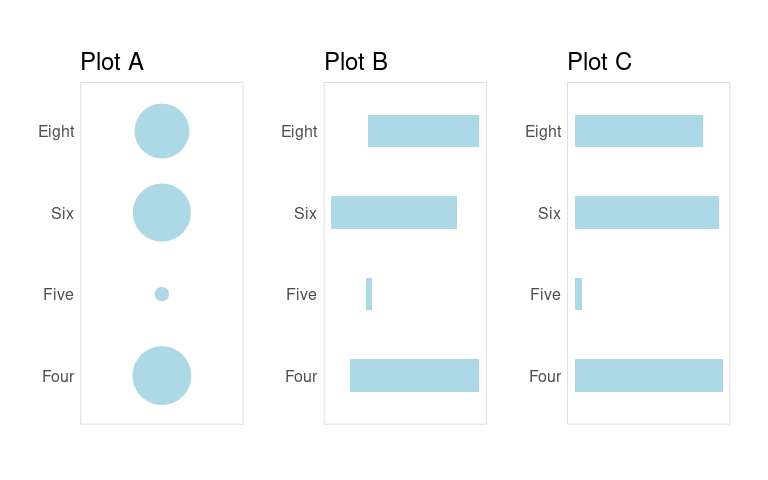
Use what you have learned about visual perception to explain which of these is better suited to allow a viewer to compare how frequently the different cylinder counts appear in the data.
Create an HTML File and Commit Your Work
You can create an HTML file in RStudio using the Knit tab on the editor window. You can also use the R command
rmarkdown::render("hw3.Rmd")with your working directory set to HW3.
Commit your changes to your hw3.Rmd file to your local git repository. You do not heed to commit your HTML file.
Submit your work by pushing your local repository changes to your remote repository on the UI GitLab site. After doing this, it is a good idea to check your repository on the UI GitLab site to make sure everything has been submitted successfully