From the Bay County ballot.
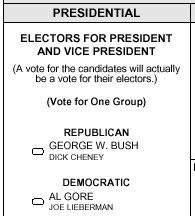
From the Monroe County ballot.
Mark Sense Ballot DesignHuman-Factors Lessons from Florida 2000
by
Douglas W. Jones
|
The debacle surrounding the general election of 2000 in Florida poses an unparalleled opportunity to learn something about how real voters respond to variations in ballot design in a real election. Because of the contested result, the media have already paid the costs of an extensive review of the ballots cast in the state, and we can get sufficient details about the ballot designs used that we can view this as an experiment in voter response to ballot design with over 2 million subjects. It is unlikely that we will have the resources to repeat an experiment of this magnitude in the coming century, and we certainly don't desire a repetition!
This is a natural experiment, in the same way that the term is used in fields such as astrophysics, macroeconomics and vulcanology. The usual way to conduct a scientific experiment is to manipulate some set of variables that serve as inputs to the system under study, the independent variables, and while we do this, observe other variables that describe the response of the system, the dependent variables. We cannot imagine conducting proper controlled experiments in fields such as astrophysics, macroeconomics or vulcanology because we cannot manipulate real stars and galaxies, we cannot afford to manipulate entire national economies, and we cannot create experimental volcanos. In such fields, we therefore seek out combinations of naturally occuring circumstances where nature has conspired to adjust the variables we wish we could manipulate in an experiment, allowing us to observe the reaction of the system we are studying to those variations.
We can carry out small scale experiments with voting technologies, but these can only reveal the coarsest elements of the voter's response to the voting system. Furthermore, it is difficult to be sure that the subjects in such artificial experiments are representative of real voters and it is difficult if not impossible to replicate the psychological setting of a general election, not only the polling place environment itself, but the impact of the saturated coverage of the month period up to a real general election.
In the case of the 2000 general election in Florida, the variety of different voting systems used in the state and the relatively lax central control exerted by the state elections office allowed each county considerable leeway in ballot design. Under normal circumstances, all we would learn from an election is the number of votes for each candidate, but the unofficial hand-recounts conducted by the newspapers in the aftermath of this election provide a wealth of data about how voters responded to the varied ballot formats. It is our goal here to lauch an exploration of how the different ballot formats influenced the success with which voters expressed their preference in the presidential race on the optical mark-sense voting systems used in Florida.
While some may decry the wide range of ballot designs that resulted from the lax central control in that election, here, we consider the resulting variation a boon! Our goal here is to identify the variations, not for the purpose of criticising Florida's election machinery, but rather, for the purpose of learning from the resulting voter behavior how best to design ballots. Our focus here is on optical mark-sense ballot design; this is the one voting technology that was widely used in Election 2000 in Florida that is likely to remain important for the forseeable future.
It is important to note that purely statistical studies of the results from the various counts and recounts, without reference to the human-factors variables and without reference to information about specific polling place procedures can lead to alarming interpretations. Where one author has seen evidence of massive fraud [1], others have seen a range of other explanations.
We will refer to a ballot on which a voter failed in an attempt to express a preference that can be counted by the vote tabulating machinery a ballot containing a miscast vote.
The term spoiled ballot is sometimes used to refer to miscast votes. This usage is found, for example, in the Florida Report of the The Governor's Select Task Force On Election Procedures, Standards and Technology and in the United States Commission on Civil Rights report Voting Irregularities in Florida During the 2000 Presidential Election, where spoiled ballots are defined (in chapter 1) as "votes cast but not counted." (March 1, 2001, Collins Center for Public Policy).
Use of the term spoiled ballot to refer to a miscast vote conflicts, in significant part, with the common definiton of a spoiled balot used in election law, "a ballot marked in error by the voter which is returned to [an election official] for another; this ballot does not go into the ballot box" (from the glossary of election terminology provided by elections Manitoba). Note that a ballot containing a miscast vote in one race may contain votes in other races that the tabulating machinery can count and that are valid under the laws of most states. Therefore, the presence of a miscast vote on a ballot does not spoil that ballot unless the voter elects to request a replacement in order to correct the error.
The work done by the MIT-Caltech voting technology project has focused on the residual vote, defined as the difference between the number of voters who attempted to cast a ballot in an election and the number of votes actually counted for one or another candidate in some particular race. If every voter who attempts to vote is actually given a ballot, the residual vote should equal the sum of the votes for the various candidates in a vote-for-one race, plus the number of overvotes plus the number of undervotes.
A ballot is counted as containing an overvote in some particular vote-for-one race if the voter apparently voted for more than one candidate in that race. Overvotes may be inadvertant or the result of misunderstood instructions; we count such overvotes as miscast votes, but in rare cases, overvotes are intentional. One voter has tole me of an election in which he met both candidates and promised each of them his vote. In order to keep his promise, he overvoted, knowing full well that doing so would be equivalent to abstention.
A ballot is counted as containing an undervote in some particular race if the voter apparently did not vote in that race. Undervotes may be miscast votes, for example, whe a voter misunderstood the ballot marking instructions, but they may also represent deliberate abstention in a particular race. The rate of intentional abstention in top-of the ticket races is usually very low; most voters have strong opinions about presidential, senatorial or gubernatorial candidates, but abstention is common on bottom-of-the-ticket races for minor local offices.
The rate at which a balloting problem occurs is the number of occurances of that problem divided by the number of voters. For example, the overvote rate in a race is the number of overvotes seen in a race divided by the number of voters participating in that race.
When dealing with mark-sense ballots, the voter is instructed to vote by making a prescribed mark in the voting target adjacent to the name of the preferred candidate. Voters who do not understand the perscribed mark are likely to miscast their votes by making nonstandard marks on their ballots. Nonstandard marks include marks of the wrong shape in or near the voting target, incorrect identification of the voting target, or use of the wrong marking implement.
This study rests on data from 3 different sources: First, we have studied the mark-sense ballots used in the 2000 general election in Florida, obtaining ballot images from county web sites wherever possible, and augmenting these with images from the State Data section of the Election 2000 collection in the University of Michigan archive of the Inter-University Consortium for Political and Social Research. In a few cases where no better images were available, ballot images were extracted from illustrations of optical scan ballots on the web pages of the Florida Ballots Project of the National Opinion Research Center. Only one county is not at least partially represented between these sources, although some of the images are very poor. These images are collected in an appendix.
The on-line web site of the Florida Secretary of State provides data for turnout and the certified vote totals for each candidate in the November 7, 2000 general election.
The on-line web site of The Miami Herald contains the data from the Miami Herald, Knight Ridder, USA-Today sponsored Ballot Review of the Overvotes and Undervotes in the November 7 general election in Florida. This review, done by BDO Seidman, LLP, contains data for all counties in Florida using optical mark-sense ballots. The USA Today web site contains subatantially the same county-level data, in slightly digested form.
For each of these counties, we have extracted the following information from these sources:
The BDO-Seidman review was far from perfect. One measure of the accuracy of the study is to ask if the numbers add up! In this case, we can ask if all of the ballots have been accounted for by asking if the sum of all of the categories of ballots identified in the BDO-Seidman review equals the residual vote. In general, the answer is, no! On average, the residual vote exceeds the number of ballots reviewed by BDO Seidman by 0.1%, but in Union, county, the excess 10 times as high, and in Calhoun, Escambia, Hamilton, Liberty and Okeechobee counties, the BDO-Seidman review actually included more ballots than the residual vote computed from the official canvass would predict. This is not a surprise; the standard programming of optical mark-sense vote tabulating machinery does not segregate undervoted ballots from others, and the method by which this segregation was done varied from county to county during both the official recounts and the various after-the-fact ballot reviews. As a result, reviews of overvoted and undervoted ballots are, at best, based in part on educated guesswork about how those ballots were actually counted on election day.
We have collected at least partial samples of all but one of the optical mark-sense ballot styles used in Florida during the 2000 general election. These are gathered in an appendix. In even the most cursory examination of these sample ballots, it is immediately obvious that the different Florida counties designed their ballots with a tremendous degree of independence. In examining the sample ballots we have so far collected, we have observed the following distinctive differences in ballot design:
Each of these is discussed in the following secitons, with illustrations showing the nature of the design difference and an investigation into the statistical impact of this difference.
Two fundamentally different types of voting target are in common use today, the broken arrow, originally used on the Optech family of precinct-count ballot tabulators, and the oval or ellipse, originally used on standardized educational tests and used on almost all other optical mark-sense applications, including the majority of the games used by the Florida Lottery and all other optical mark-sense voting systems. It is also noteworthy that all members of the Optech family of tabulating systems are compatable with oval voting targets, although most users of this family of scanners, including all in Florida, use the broken-arrow style of target.
![]()
From the Bay County ballot.
![]()
From the Monroe County ballot.
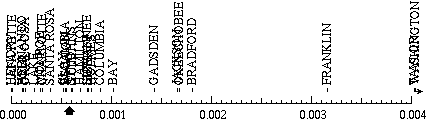
Counties with broken arrows: Baker, Bay, Clay, Escambia, Holmes, Orange, Santa Rosa, St. Johns, Washington; 657,145 voters.
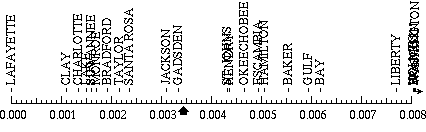
Counties with ellipses or ovals: Alachua, Bradford, Brevard, Calhoun, Charlotte, Citrus, Columbia, Flagler, Franklin, Gadsden, Gulf, Hamilton, Hendry, Hernando, Jackson, Lake, Lafayette, Levy, Leon, Liberty, Manatee, Monroe, Okaloosa, Okeechobee, Polk, Putnam, St. Lucie, Seminole, Volusia Suwannee, Taylor, Walton; 1,696,666 voters.
Hypothesis: Because broken arrows are not used as targets in any other mark-sense application, while elliptical or oval targets are common on lottery, educational testing and consumer survey mark-sense forms, voters are likely to need less instruction with oval or elliptical targets and are more likely to misinterpret voting instructions for the unfamiliar broken arrow target. Both styles of target are, however, easy to mark correctly, so this effect should be subtle except when the instructions are particularly poorly worded.
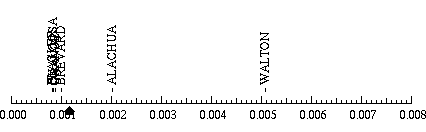
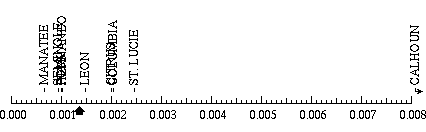
Testing the hypothesis: A quick test of this hypothesis is very misleading! Looking just at the residual vote for these two groups of counties, we find an overall rate of 0.015 for counties using broken arrow targets and and 0.014 for counties using ovaltargets. This mixes precinct-count and central-count systems on the oval target side of the picture. Looking only at comparable precinct count systems, the residual rate for oval targets drops to 0.006, but this is also misleading! Breaking things down by counties, we arrive at the following comparison:
| Optech residual votes (precinct-count broken-arrow target) |
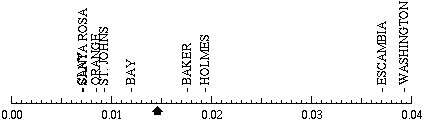
|
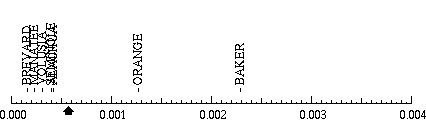
| Global residual votes (precinct-count oval target) |
|
The wide spread between individual counties in the above plots gives a strong hint that other factors were at work! The problem with this data is that the residual vote folds together a large number of problems, ranging from overvotes to use of the wrong type of marking implement. Furthermore, some of these are strongly influenced by other problems; in the case of Columbia, Escambia and Manatee counties, for example, the cominant contributor to the high residual votes in those counties was the result of the disabling or overriding of the "second chance" features of the voting machines, as reported in the Orlando Sentinel on May 6, 2001 ("New system fumbles votes").
The BDO-Seidman data allows us to distinguish between a variety of ballot mismarkings, allowing us to exclude mismarkings such as use of the wrong pen or pencil or various overvotes and look only at mismarkings that could possibly have resulted from a voter's failure to properly recognize the voting target or to properly make the prescribed mark in it. Looking at the entire BDO-Seidman dataset for optical mark-sense counties, we see the following differences:
| Broken Arrow | Oval | |
|---|---|---|
| Underline Name | 0.00008 | 0.00001 |
| Circle Name | 0.00021 | 0.00027 |
| Circle Target | 0.00029 | 0.00005 |
| Wrong Mark | 0.00047 | 0.00021 |
| Total Mismarkings | 0.00104 | 0.00054 |
| Other | 0.00014 | 0.00013 |
| Abstention | 0.00289 | 0.00153 |
The above table shows that almost twice as many voters had difficulty making the perscribed mark on ballots using broken-arrow targets as on ballots using ovals or ellipses, and almost twice as many abstained from voting for president on these ballots. This seems to confirm the hypothesis, but if we look more closely, we find that other factors are muddying the picture.
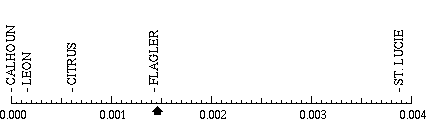
| Total Mismarkings on Optech broken-arrow ballots |
|
| Total Mismarkings on oval-target ballots |
|
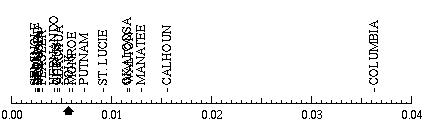
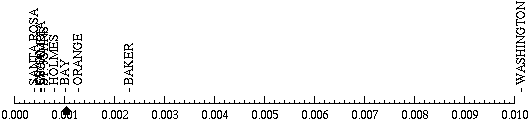
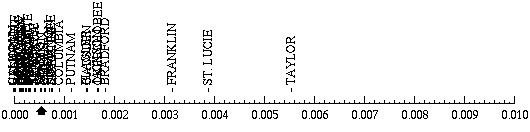
Here, we see that two counties, Baker and Washington, are outliers among the users of broken-arrow voting targets; excluding these, the mismarking rate falls to 0.00090. Among users of oval targets, we find three more counties, Franklin, St. Lucie and Taylor, that are outliers; excluding these, the mismarking rate falls to 0.00035.
Given the tight clustering in the data from the other counties, we can speculate that something else was at work in these outlier counties. Excluding them, we still see that the oval voting target appears somewhat superior, but we are dealing with very small numbers of voters here, fewer than one voter in 500, and the variations between counties that use the same styles of voting target exceeds the difference between the average mismarking rates for the different styles of voting target. Therefore, on the whole, it appears likely that the impact of other problems has dominated any impact of the style of voting target.
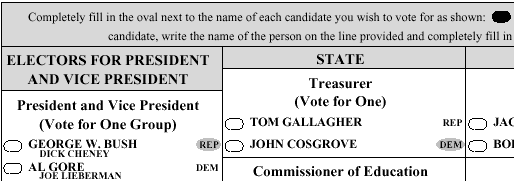
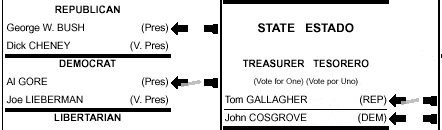
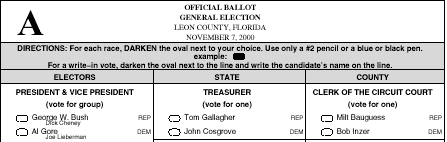
Florida law favors placing the voting target to the right of the candidate's name, but it does this in a roundabout way, and the majority of users of optical mark-sense voting systems used ballots with the target to the left of the name.
The applicable law in 2000 required wording on hand-counted paper ballots that implied that the target was to the right of the candidate's name (2000 Florida Statute 101.151 [3a]), and it required that, where practicable, machine readable ballots be organized in the same way as hand-counted paper ballots (2000 Florida Statute 101.5609 [2]). The two examples given below were both designed to be read by the same make of ballot tabulating machine, demonstrating that it was clearly practicable to follow the format implied by the law, but evidently, many counties felt free to arrange ballots the other way.
![]()
From the Polk County ballot.
![]()
From the Monroe County ballot.
Counties with targets to the right: Baker, Bay, Brevard, Clay, Escambia, Holmes, Manatee, Monroe, Orange, Santa Rosa, St. Johns, Seminole, Volusia, Washington; 1,125,039 voters.
Counties with targets to the left: Alachua, Bradford, Calhoun, Charlotte, Citrus, Columbia, Flagler, Franklin, Gadsden, Gulf, Hamilton, Hendry, Hernando, Jackson, Lafayette, Lake, Leon, Levy, Liberty, Okaloosa, Okechobee, Polk, St. Lucie, Suwannee, Taylor, Walton; 966,555 voters.
Hypothesis: Because most voters are right-handed, placing the target on the right is likely make it easier for voters to see the candidate's name while they mark the target, in contrast, placing the target on the left will put a right-handed voter's hand over the name while marking the target. Because of this, it is possible that a few more voters will mismark their ballots when the target is to the left.
Testing the hypothesis: Again, we find that the residual vote is a misleading indicator, with almost twice as many voters having problems on systems where the target was to the left (0.019) as on the right (0.011). The problem is, this includes problems that we cannot attribute to the location of the voting target, for example, use of the wrong type of pen or pencil.
We do not expect the location of the target to the left or right of the candidate's name to confuse voters about the form of the perscribed mark. The total mismarking category derived from the BDO-Seidman data bears this out; the rates are very similar, 0.00071 for the left-handed counties and 0.00074 for the right-handed ones.
We might expect a difference in the overvote rate, since covering the name while marking a voting target may lead to marking the wrong target, but other sources of overvotes make it extremely unlikely that we will see this in the overvote data. Most voters, on making an overvote for this reason, ought to seek a new ballot, so this would show up in the number of spoiled ballots. Unfortunately, the number of spoiled ballots is not generally available.
Voters who do not seek a new ballot would be expected to make an erasure or crossout. Most erasures are counted as intended by the voter on today's optical mark-sense ballot tabulators, despite the fact that they are prohibited by the rules of most jurisdictions. In the BDO-Seidman data, darkly smudged erasures would fall in the category of overvotes for which voter intent could be determined, as would crossouts. Unfortunately, the BDO-Seidman data does not distinguish between these and ballots where the voter voted for a candidate and then used the write-in blank to vote for the same candidate.
Therefore, to see this effect, if it is visible at all in the Florida data, we will need to look closely at counties that used ballot formats with the same shortcomings in areas that would otherwise lead to overvotes. WORK REMAINS TO BE DONE!
On ballots where the voting target was to the left of the candidate's names, several counties placed 3-letter party abbreviations to the right. These abbreviations were very close to the size of a voting target, and were positioned exactly where a voting target would be if it had been to the right.
![]()
From the Leon County ballot.
![]()
From the Hernando County ballot.
Counties with no obvious spurious target: Bay, Bradford, Charlotte, Clay, Columbia, Escambia, Franklin, Gadsden, Gulf, Hamilton, Hendry Hernando, Holmes, Jackson, Lafayette, Lake, Liberty, Monroe, Okaloosa, Okeechobee, Polk, Santa Rosa, St. Johns, Suwannee, Taylor, Walton, Washington; 1,012,129 voters.
Counties with party or office identifier adjacent to voting target: Alachua, Baker, Brevard, Manatee, Orange, Seminole, Volusia; 1,029,761 voters.
Counties with party identifier opposite voting target: Calhoun, Citrus, Flagler, Leon, St. Lucie; 202,015 voters.
Hypothesis: For voters with limited vision, the voting target and the three-letter abbreviation of the party name may look like similar blurry ellipses. Such voters could easily vote by filling in the wrong ellipse, particularly when the instructions do not clearly show both voted and unvoted targets or when the instructions do not clearly illustrate the relationship between target and candidate's name.
Testing the hypothesis: The residual vote is a misleading indicator here! For the three categories identified here, ballots with no obvious target (0.02518), those with a spurious target near the official target (0.00568) and those with a spurious target opposite the official target (0.00519), the residual numbers suggest that spurious targets are actually helpful! In fact, this is due to an extraordinarily high overvote rate on the ES&S central count ballots, none of which featured spurious targets in their design.
If we look at the total mismarking figure, a figure that includes only categories of voter errors that could result from misunderstanding the nature of the voting target or the shape of the perscribed mark, the story is different. In this case, the numbers for ballots with no obvious target (0.00058), those with a spurious target near the official target (0.00057) and those with a spurious target opposite the official target (0.00146) shows clear support for our hypothesis.
| Mismarkings with no obvious spurious voting target: |
|
| Mismarkings with spurious target adjacent to voting target: |
|
| Mismarkings with spurious target opposite voting target: |
|
It is noteworthy that the Orange County ballot was bilingual, doubling the total body of text facing the voter, and the Baker County ballot had both very crowded typography and minimal instructions. This lends credence to the idea that spurious targets adjacent to the actual target were rarely troublesome. The wide spread of the data for mismarkings on ballots with no obvious spurious target is a clear indication that other problems also lead to mismarkings. It is noteworthy that the BDO-Seidman data for Calhoun County apparently classified all undervotes as abstentions, since none of the other categories of undervotes were reported; omitting the Calhoun County data increases our confidence in this hypothesis.
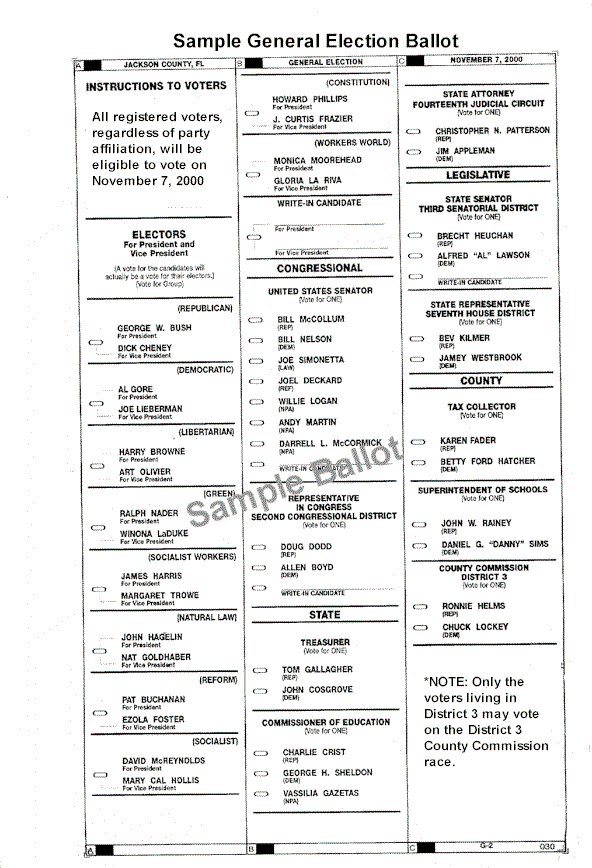
Counties varied considerably in the amount of text they added to each candidate's name. Some simply gave the names compactly, others gave the office by each name, sometimes at the expense of quite a bit of space on the ballot.
![]()
From the Polk County ballot.
From the Jackson County ballot.
Counties spelling out office name: Baker, Bay, Bradford, Charlotte, Clay, Escambia, Franklin, Gadsden, Gulf, Hamilton, Hendry, Holmes, Jackson, Lafayette, Lake, Liberty, Monroe, Okechobee, Santa Rosa, St. Johns, Suwannee, Taylor, Washington; 676,092 voters.
Counties abbreviating office name: Alachua, Brevard, Okaloosa, Orange, Flagler, Walton; 704,905 voters.
Counties not mentioning office name: Calhoun, Citrus, Columbia, Hernando, Leon, Manatee, Polk, St. Lucie, Seminole; 748,755 voters.
Hypothesis: Adding this extra text to each candidat's name forces the voter to read more and is unlikely to help the voter find the candidate's name or the associated voting target.
Testing the hypothesis: The residual vote rates for these three categories suggest that something big is going on. The overall residual vote rate for counties spelling out the office name was 0.03347, while for those abbreviating or omitting the office name, the rates were 0.00645 and 0.00678. It turns out, however, that all of the counties that used two column ballots also spelled out the office name, and the overvotes that resulted from the two column design clearly dominates the residual figures.
Our hypothesis is that the extra text added to the ballot makes voting difficult; looking at the measures we have, we don't expect added text between the candidate names to lead to difficulty expressing the correct mark, nor do we expect this text to lead to overvotes or use of the wrong marking implement. This leaves two categories from the newspaper data, abstentions and other. Remarkably, the abstention data appear to bear out our hypothesis! The overall abstention rate in counties that spelled out the office name under or beside each candidate's name was 0.00344, while it was only 0.00115 in counties where the office name was abbreviated, and 0.00136 in counties where the office name was omitted entirely.
| Abstention rates where office names are spelled out: |
|
| Abstention rates where office names are abbreviated: |
|
| Abstention rates where office names are omitted: |
|
When we look at the data in more detail, this hypothesis appears to be a useful explanation of why a significant number of people abstain! There are odd counties, though. The abstention rates of 0.00000 in Lafayette County and 0.01465 in Calhoun County are strange, but in the former case, the BDO-Seidman data is all zero for undervote categories, and in the latter case, the all undervotes appear to have been lumped in this category. If we ommit the data for these counties, it only serves to reinforce this hypothesis!
It is noteworthy that the high abstention rates in Franklin (0.01026), Holmes (0.01021) and Washington (0.01389) cannot be written off in this way -- all show nonzero totals for at least some of the other undervote categories.
There is one serious reason to doubt that this data supports the hypothesis! All of the counties omitting the office name used the Global Election Systems precinct-count ballot scanners, and among those abbreviating the office name, all one used the Global system; Orange County used the Optech precinct-count scanner. While this does cast some doubt on the hypothesis, it is worth noting that both the ES&S central-count ballot scanners and the Global precinct-count scanners use visually similar oval or elliptical voting targets, and it is hard to come up with any other hypothesis aside from typography to explain the significant difference in abstention rates we have observed here.
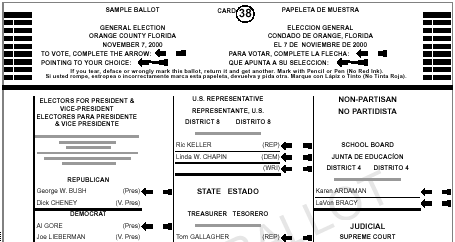
Some ballots were bilingual English and Spanish, while others were English only.
From the Orange County ballot.
From the Bay County ballot.
Bilingual counties: Orange, Hendry, Monroe; 325,574 voters.
English only counties: Alachua, Baker, Bay, Bradford, Brevard, Calhoun, Charlotte, Citrus, Clay, Columbia, Escambia, Flagler, Franklin, Gadsden, Gulf, Hamilton, Hendry, Hernando, Holmes, Jackson, Lafayette, Lake, Leon, Levy, Liberty, Manatee, Okaloosa, Okeechobee, Polk, St. Johns, St. Lucie, Santa Rosa, Seminole, Suwannee, Taylor, Walton, Washington; 1,826,618 voters.
Hypothesis: Bilingual text adds to the total text a voter must wade through while voting, so it probably disadvantages everyone, to a modest extent, as it aids those voters with weak English.
Testing the hypothesis: Unfortunately, the BDO-Seidman data for Hendry county appears to have lumped all undervotes into the abstention category, leaving us with just two bilingual counties, Monroe and Orange. With over 282,000 voters, the Orange county data overwhelms everything else when only one or two other counties are averaged with it. As a result, we cannot use the broad multicounty methods we have generally been using. Instead, we will have to compare Orange county with data from other counties that used almost exactly the same ballot layout, except without being bilingual. WORK NEEDS TO BE DONE!
Some ballots included almost no auxiliary white space or other typographical breaks between pairs of running mates, while others were quite generous with white space.
![]()
From the Citrus County ballot.
![]()
From the Leon County ballot.
From the Hernando County ballot.
From the Polk County ballot.
Tight Packing: Citrus, Leon, St. Lucie, Seminole.
Mid-range Packing (worse typography): Baker.
Mid-range Packing (better typography): Bay, Brevard, Clay, Escambia, Flagler, Hernando, Holmes, Manatee, Monroe, Okaloosa, Santa Rosa, St. Johns, Walton.
Loose Packing: Alachua, Calhoun, Columbia, Orange.
Very Loose Packing: Bradford, Charlotte, Franklin, Gadsden, Gulf, Hamilton, Hendry, Jackson, Lafayette, Lake, Liberty, Levy, Okeechobee, Polk, Suwannee, Taylor.
Hypothesis: Clear separation of pairs of running mates, with party affiliations that are easy to read and easy to relate to the candidate names should aid voters in effectively expressing their preference. In contrast, packing the list of candidates into a uniform looking grey blur should increase the error rate.
From the Leon County ballot.
From the Jackson County ballot.
One column counties: Alachua, Baker, Brevard?, Bay, Calhoun, Citrus, Clay, Columbia, Escambia, Flagler, Hernando, Holmes, Lake?, Leon, Manatee, Monroe, Okaloosa, Orange, Polk, St. Lucie, Santa Rosa, St. Johns, Seminole, Walton.
Two column counties: Bradford, Charlotte, Franklin, Gadsden, Gulf, Hamilton, Hendry, Jackson, Liberty, Okeechobee, Suwannee, Taylor.
Apparently, a sample ballot designed by the Florida Division of Elections as a guide to help counties design their own ballots was among those that divided the list of presidential candidates into two columns (see "Some had 1 from 'column A', 1 from 'column B'," The Orlando Sentinel, Orlando, January 28, 2001).
Hypothesis: As has been widely noted in the media, breaking the candidate list in two invites confusion; this is the most obvious of all of the hypotheses presented here! It should be noted that this hypothesis interacts significantly with our hypothesis about the packing of candidate choices on the ballot. Tight packing makes a split candidate list unlikely, while very loose packing or inclusion of long blocks of instructions in the first column can force a split in the presidential candidate list.
![]()
From the Walton County ballot.
![]()
From the Hernando County ballot.
![]()
From the St. Lucie County ballot.
From the Bay County ballot.
Instructions covered write-in voting: Alachua, Baker, Bay, Bradford, Brevard, Calhoun, Charlotte, Citrus, Clay, Escambia, Flagler, Franklin, Gadsden, Gulf, Hamilton, Hendry, Hernando, Holmes, Jackson, Lake, Liberty, Leon, Manatee, Monroe, Okeechobee, Polk, St. Lucie, Santa Rosa, St. Johns, Suwannee, Taylor.
Instructions mentioned marking implement: Baker, Bay, Brevard, Clay, Gulf, Escambia, Holmes, Liberty, Leon, Orange, Santa Rosa, St. Johns.
Instructions covered replacement ballots: Bay, Brevard, Clay, Escambia, Holmes, Liberty, Okaloosa, Orange, Santa Rosa, St. Johns, Walton.
Hypothesis: Terse but accurate instructions covering all 4 major issues are likely to perform better than either long-winded instructions or instructions that omit major details. Unfortunately, none of the instructions in our collection of ballots combine all of these virtues.
![]()
From the Hernando County ballot.
![]()
From the Orange County ballot.
Illustrated both voted and unvoted targets: Baker, Bay, Clay, Escambia, Holmes, Orange, Santa Rosa, St. Johns.
Illustrated only voted targets: Alachua, Bradford, Calhoun, Charlotte, Citrus, Columbia, Flagler, Franklin, Gadsden, Gulf, Hamilton, Hendry, Hernando, Jackson, Lake, Leon, Liberty, Manatee, Monroe, Okaloosa, Okeechobee, Polk, St. Lucie, Seminole, Suwannee, Taylor, Walton.
Hypothesis: Illustrating only the voted form of the target provides no hint about how the target looked before it was voted. Voters unfamiliar with the "fill in the oval" ballot might therefore be expected to create marks that look like the mark given in the instructions but are not located on the voting target.
![]()
From the Orange County ballot.
![]()
![]()
From the St. Lucie County ballot.
Illustrations clearly match use: Orange, Monroe, Seminole.
Illustrations similar to use: Alachua, Baker, Bay, Bradford, Calhoun, Charlotte, Clay, Escambia, Franklin, Gadsden, Hamilton, Hernando, Holmes, Santa Rosa, St. Johns.
Illustrations clearly mismatched with use: Citrus, Columbia, Flagler, Gulf, Lake, Leon, Okaloosa, Jackson, Okeechobee, St. Lucie, Suwannee, Taylor, Walton.
Hypothesis: Where the example voting targets are on one side of the instructions, while the official targets are on the other side of the candidate names, naive voters may be led to invent alternative voting targets, particularly when there are conveniently placed markings on the ballot that have the same general size as a voting target, as in the three-letter party abbreviations in the St. Lucie County example shown.
![]()
From the Bay County ballot.
Counties with two versions: Bay, Clay, Escambia, Holmes, St. Johns
Counties with one version: Alachua, Baker, Bradford, Calhoun, Charlotte, Citrus, Columbia, Flagler, Franklin, Gadsden, Gulf, Hamilton, Hendry, Hernando, Jackson, Lake, Leon, Liberty, Manatee, Monroe, Okeechobee, Okaloosa, Orange, Polk, Santa Rosa, St. Lucie, Seminole, Suwannee, Taylor, Walton.
Hypothesis: Because a voter might read one of the two presentations of the voting instructions without finding the other, there is the possibility that the voter may misunderstand something that would have been clarified if the voter had found and read both sets of instructions. Therefore, it is reasonable to expect fewer errors on ballots where the same information is presented in one place instead of in two.
From the Bay County ballot.
From the Leon County ballot.
Hypothesis: Giving voters an explanation of the electoral college on the ballot only adds to the text they have to wade through in voting, and does nothing to clarify the actual voting process. Therefore, adding this text might lead to a marginal increase in the rate of voter error.
From the Bay County ballot.
From the Polk County ballot.
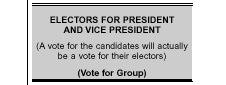
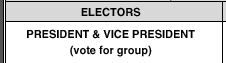
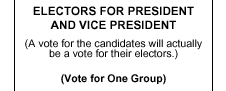
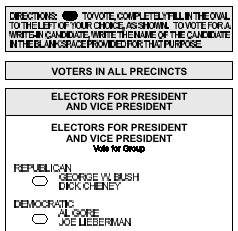
The wording "vote for group" has been used in Florida for several election cycles (see, for example, the Martin County ballot from 1996).
Hypothesis: As has been pointed out in the press after the election, the instruction "vote for one" could be misinterpreted as an invitation to vote for a group of presidential candidates, an overvote (see Ballots offer clues to intent, The Miami Herald Friday, May 11, 2001). The addition of the single word "one" may well reduce the likelyhood of this misreading, even though the meaning of the phrase "vote for one group" is still obscure. The lack of uniformity we have documented above is almost certainly a serious violation of the civil rights of Florida voters, and the lack of uniformit is far greater than can be justified by differences between the three different vote tabulating systems represented! The law demands that the voters in any election be given an equal chance to have their vote count, and we cannot assure this if the voters in different counties are given different instructions on how to vote, and given ballot designs that pose different problems for voters attempting to figure out how to express their preference for one or another candidate.
Nonetheless, this same lack of uniformity is precisely what we need if we are to view the results from Florida as a natural experiment that we can use to study the impact of various ballot designs. We hope, through this study, that we can bring some good out of the unfortunate outcome of the 2000 general election in Florida!
Ballot design is not the only independent variable we must examine in this experiment! In some counties, voters had used ballots designed for optical mark-sense ballot tabulation for many years. The voting system vendors have been very helpful, providing us with the date of aquisition for the voting system in use in each of the 40 Florida counties using optical mark-sense voting systems, but when counties have upgraded from earlier systems, these figures can be misleading. For example, the vendor, Global Election Systems, reported that Leon County adopted its current voting system in 1997, while press reports indicate the first use of such ballots in Leon County as having been in 1992 (see " Optical scan a success in Leon," St. Petersburg Times, St. Petersburg, Feb 25, 2001).
A large number of other counties only just adopted their current voting systems, many in response to questions of year 2000 readyness. Alachua County, for example, only moved to mark-sense ballots in 9999 (see " Redistricting may pose need to buy more voting machines," The Gainesville Sun, Gainesville, Feb 22, 2001), and miscast votes were extremely common (see " Alachua County ballot check shows voter errors," Jan 3, 2001).
Hypothesis: The number of miscast ballots should decline as voters gain experience with new technology.
Questions about the voters response to instructions on the ballot itself are complicated by the instructions, if any, provided elsewhere in the polling place. Some jurisditions routinely use instructional posters in the polling place or in each voting booth. Some jurisdictions even require that the voter mark a voting target at the time they sign-in to vote, while a polling place worker is there to monitor and instruct them.
A second class of complications arises from the programming of the ballot tabulating systems themselves. Some of the precinct-count ballot tabulators that were used had the capability of detecting overvoted ballots and returning these ballots to the voter. This feature is present in some of the ES&S Optech machines and all of the Global Accu-Vote machines, but it was not enabled in all counties where it was available. For example, this feature was present but disabled in Escambia and Manatee Counties, and while it was enabled in Manatee County, administrative procedures limited its effectiveness. (see "New system fumbles votes," The Orlando Sentinel, Orlando, May 6, 2001).
Where overvotes were detected and voters were allowed to correct their ballots, ballot designs that somehow invited overvotes not show up in the ballot box and therefore, statistics from either the official election returns or the unofficial hand recounts would not disclose the problems with these ballot designs. Therefore, therefore, we must ask, in each county, whether overvoted ballots were accepted without giving the voter a chance to make corrections.
It is noteworthy that absentee voters never receive the opportunity to make such correctons, so, for each county where voters were given a second chance, the absentee statistics should be examined separately.
There is no official count of the miscast votes in the election, but there are many useful numbers that should correlate with this! The most obvious of these numbers can be computed from the official election returns. The official figures from the state-wide canvass of the election give the number of votes in each county for each of the candidates listed on the ballot, and they include county by county turnout figures. (See the Florida Secretary of State's web site, http://election.dos.state.fl.us and look under election results for 11/7/2000.)
In each county, we can add the total number of votes for all presidential candidates on the ballot to get the total number of counted presidential votes and subtract this from the turnout to get the total number of ballots in each county that contained no counted presidential vote. The resulting number has been widely used as a measure of the number of miscast votes, but it actually contains a number of other components:
While the official state election returns did not include the number of miscast votes, some counties did report additional useful numbers. Essentially all computerized voting systems are able to report two useful numbers as part of their tabulation:
The AP reported on the number of overvotes and undervotes on November 21, 2000, taking the data from those counties that included this data in their totals. The original of this report seems to have dissapeared from the on-line world, but two secondary sources agree on the key components, Florida Counties - Votine Machine Type, Recounts, Undervotes Free Republic, 11/24/00 and Tom Sawyer's personal archive.
undervotes reported by the unofficial recount, we can approximate the actual number of ballots. The uncertainty in this approximation arises from our uncertainty about how many of the non-perscribed marks were actually detectable in the machine count or acceptable in the hand recounts.
Since we are interested in the relationship, if any, between the voting system used and the nonstandard ballot markings made by voters, we also need to know the type of voting system used in each county. This is also available from the Florida Secretary of State.
Appendix A contains both the raw data we obtained from the web sites mentioned above and the frequency data we obtained by combining data from the Secretary of State with data from the hand recounts. Appendix B contains sample ballots from several Florida counties. Our basic methodology in the remainder of this section is to look in the data for counties that attract unusual numbers of non-perscribed ballot markings and then examine ballots from those counties, where they are available, in order to determine what ballot features appear to have invited those markings.
In summary, the data from the 40 Florida counties that used optical mark-sense voting systems in the November 2000 general election plus data from the one county that used hand-counted paper ballots covers approximately 2,342,789 ballots. We include hand-counted paper ballots here because they are subject to many of the same kinds of voter errors. Out of all these ballots, the Miami-Herald Knight-Ridder USA-Today Data shows use of nonstandard ballot markings as follows:
Unfortunately, this difference includes three components, the number of intentional abstentions, where the voter had no presidential preference, the number of write-in votes, where the voter successfully voted for a candidate who's name was not on the ballot, and the number of voters who failed to express a preference.
Until the recounts following the contested November 2000 general election in Florida, there was little but anecdotal evidence to hint at the frequency with which voterd marked on ballots with non-perscribed marks. While the data from the official Florida recounts offered some help, this was limited. All that was reported was the number of overvotes and undervotes on the presidential race. These overvotes included many that resulted from voter reaction to poorly designed ballots, and all undervotes were lumped together so it was impossible to distinguish deliberate undervotes undervotes resulting from various non-perscribed markings.
The unofficial recount undertaken by BDO Seidman LLP at the request of The Miami-Herald, Knight-Ridder and USA-Today newspapers changes this, but it is important to note the limitations of this count.
We did not make a determination as to which ballots were included in the tabulated machine or manual count, as certified by the State of Florida ...In sum, this recount did not count undervotes, it counted ballot markings that deviated from the perscribed mark, whether or not these marks were detectable or acceptable. Nonetheless, the results of this effort are extremely useful.Letter from BDO Seidman, LLP to The Miami Herald, Knight Ridder and USA Today, Re: Tabulation of "Under Votes" for the State of Florida, March 30, 2001.
The raw data for this recount is available from the Miami Herald web site, This data was based on examination of all ballots cast in the state of Florida and gives, for each precinct in the state, the number of ballots containing no vote for president or a non-perscribed marking in the presidential race, with such markings divided into six classes. These classifications were decided in advance, and there was some difficulty fitting actual ballot markings into these classes; This is documented in
Accounting firm, Herald joined in Statewide Effort, The Miami Herald Feb 26, 2001; page 17A
For our purposes, we are not very interested in the raw numbers, except to the extent that they help us understand the errors voters are likely to make. It is the errors themselves, or rather, the non-perscribed marks voters make, that are the focus of our interest, and our primary interest in the numbers is to find the features of the ballot that invite such markings.
The raw numbers are not as interesting as the frequencies of the markings, and to compute these, we need to know how many ballots were cast in each county. Unfortunately, this number is not uniformly available, although several county web sites do give it. What we can get, from the web site of the Florida Secretary of State, is the total number of votes cast for each presidential candidate. Adding to the vote totals for each candidate to the number of overvotes and undervotes reported by the unofficial recount, we can approximate the actual number of ballots. The uncertainty in this approximation arises from our uncertainty about how many of the non-perscribed marks were actually detectable in the machine count or acceptable in the hand recounts.
Since we are interested in the relationship, if any, between the voting system used and the nonstandard ballot markings made by voters, we also need to know the type of voting system used in each county. This is also available from the Florida Secretary of State.
Appendix A contains both the raw data we obtained from the web sites mentioned above and the frequency data we obtained by combining data from the Secretary of State with data from the hand recounts. Appendix B contains sample ballots from several Florida counties. Our basic methodology in the remainder of this section is to look in the data for counties that attract unusual numbers of non-perscribed ballot markings and then examine ballots from those counties, where they are available, in order to determine what ballot features appear to have invited those markings.
In summary, the data from the 40 Florida counties that used optical mark-sense voting systems in the November 2000 general election plus data from the one county that used hand-counted paper ballots covers approximately 2,342,789 ballots. We include hand-counted paper ballots here because they are subject to many of the same kinds of voter errors. Out of all these ballots, the Miami-Herald Knight-Ridder USA-Today Data shows use of nonstandard ballot markings as follows:
Bay County is the home of Panama City, with a population of 150,000; this was the first presidential election in Bay County using new ES&S (previously BRC) Optech precinct-count ballot tabulating machines (see "County hesitates on computer purchase," The News Herald, Panama City, December 17, 1997). It is notable that, in the instructions for voting in Bay County, the examples illustrating proper marking in the voting target were separated from the text. A naive voter reading the text could misinterpret the instructions as illustrated below; this marking would be classified as underlining the candidate's name under the rules used for classifying nonstandard ballot markings in the unofficial recounts!
Full ballot image available
It is noteworthy that the instructions for voting in Clay county were formatted identically to those used in Bay county. Clay County is very similar in size, with 57,690 ballots cast in the election, yet no ballots were classified as having an underlined candidate name. Clearly we have not yet uncovered the entire story.
St. Lucie County, the home of Fort Pierce, with a population of 180,000, used the Global Election Systems ES 2000 AccuVote precinct-count tabulating system. The ballots used here have a neatly printed column of three-letter party abbreviations to the right of the candidate's names. The party abbreviations are almost exactly the size of the voting targets, and the instructions only show a filled voting target, with no example of what the oval looked like before it was filled. Apparently, a significant number of voters were looking for a voting target to the right of the candidate's names and concluded that the party abbreviation was to be used as the target!
Full ballot image available
Compare this with the almost identical ballot layouts used in Polk County, where only 4 of 169,489 ballots (0.002%) were marked this way and in Monroe County, where none of 34,065 ballots were marked this way. The only real difference between the St. Lucie County ballot and the Polk County ballot lies in the replacement of the three-letter party abbreviations in the presidential candidate list with spelled out party names.
In Polk and Monroe counties, the possibility that a voter would mistake a three letter party abbreviation for a voting target has been eliminated by spelling out the party names in full for the presidential race. Curiously, in both ballots, the three letter abbreviations were preserved in all other races.
Full ballot images available
All but the Monroe County ballot discussed above are in apparent violation of Florida law, which asks, in a somewhat roundabout way, that the voting target be to the right of the candidate's name.
Beneath the caption and preceding the names of candidates shall be the following words: "To vote for a candidate whose name is printed on the ballot, place a cross (X) mark in the blank space at the right of the name of the candidate for whom you desire to vote. ..."2000 Florida Statute 101.151 (3a). This governs non-machine readable paper ballots.
The ballot information shall, as far as practicable, be in the order of arrangement provided for paper ballots.
2000 Florida Statute 101.5609 (2). This governs machine-readable ballots.
In any case, we have not uncovered the full story. The ballot used in Citrus County, for example, had essentially the same layout as that used in St. Lucie County, yet only 18 of 57,443 ballots (0.031%) were marked this way, and the story is similar in Leon County, where only 12 of 103,354 ballots (0.012%) were marked this way.
The low rate of such markings in Leon County and Monroe counties may be due, in part, to the fact that that these counties were among the first in Florida to adopt the Global Election Systems ES 2000 AccuVote precinct-count tabulating system. This was first used in 1992 in Leon County (see " Optical scan a success in Leon," St. Petersburg Times, St. Petersburg, Feb 25, 2001) and it was first used in 1993 in Monroe County (see " Monroe's ballot scan swift, sure," The Miami Herald, Miami, November 14, 2000). As a result, most voters in these counties had used the system many times before the 2000 general election.

Orange County, home of Orlando, with a population of 680,000, used the ES&S (previously BRC) Optech precinct-count ballot tabulating machines. There is nothing obvious in the instructions on the Orange County ballot that would encourage this such marks. In Bay County, where the same voting ballot tabulators were used, no ballots were counted with such marks, yet the instructions on that ballot were, if anything, less effectively designed.
Full ballot image available

It is difficult to find a convincing explanation for the different rates with which this error occurs in different counties, but the fact that Orange County voters were prone to making a variety of errors that suggested they hadn't read the directions leads us to a hypothesis. Note that the voting instructions on the Orange County ballot are above the line dividing ballot identifying information (county, ballot style, date, etc) from the voting area, and furthermore that the text in this area is relatively dense because of the bilingual design. It could be that a modest fraction of the voters simply ignored all of the text above this line!
Full ballot image available
Full ballot image available
Voter familiarity with the ballot may be another factor that leads voters to use an X or a check instead of the perscribed mark. In Alachua County, which purchased the Global Election Systems ES 2000 AccuVote precinct-count tabulating system in 1999, 26 of 86045 ballots (0.030%) were marked this way, (see " Redistricting may pose need to buy more voting machines," The Gainesville Sun, Gainesville, Feb 22, 2001). In contrast, the rate in Leon County, the first to adopt this voting system, only 6 of 103,354 ballots (0.006%) were marked this way.

Unfortunately, an improper marking device with one voting machine may be perfectly acceptable with another, but the instructions on the Orange County ballot, to "mark with pencil or pen (no red ink)" are unusually generous! It is no surprise that only 6 of 281,939 ballots (0.002%) were marked in violation of this definition of a perscribed mark. On the other hand, there is good reason to wonder if the vote tabulating machines will really pick up all other colors of pen and pencil marks!

Full ballot image available
The instructions on the Leon County ballot are probably a more accurate representation of what modern mark-sense tabulating machines can reliably handle: "Use only a #2 pencil or a blue or black pen." None of the 103,354 ballots cast in Leon County were marked with the wrong device! Note that the directions on the Leon County ballot are highlighted and stand out very clearly from both the ballot identifying information and the races on the ballot.
Full ballot image available

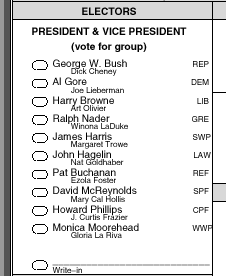
All of the basic types of mark-sense vote tabulation systems used in Florida are represented in the the list of counties with unusually high abstention rates, but the list of counties with unusually low abstention rages is dominated by counties using the Global Election Systems ES 2000 AccuVote precinct-count tabulating system, where the overall abstention rate of 0.132% was observed, in contrast to the rates of 0.234% and 0.289% observed on the other two optical mark-sense systems. Given that the smallest sample size involved is 277,750 ballots, the factor-of-two variation between the systems appears significant, but there is no obvious difference in ballot design that would lead to such a difference. The basic instruction "vote for one" or the more confusing "vote for group" used in the presidential race appears on all ballots.
Overvotes were most common in Gladsdon County (1844 of 16,673 ballots, or 11.060%), but there were 11 other counties where more than 5% of the presidential voters were led to overvote. All of these counties used ES&S central count systems! In contrast, all 6 counties with overvote rates under 0.1% used the Global Election Systems ES 2000 AccuVote precinct-count tabulating machine.
It is noteworthy that the Global and the newer Optech precinct-count tabulating machines may be configured to detect and reject ballots containing overvotes, so that voters can correct their errors. In Escambia and Manatee Counties, this feature was disabled, and in Columbia County, poll-worker actions had much the same effect (see "New system fumbles votes," The Orlando Sentinel, Orlando, May 6, 2001). These counties stand out in the overvote statistics, with overvote rates 5 to 10 times the average seen in other counties using the same voting systems.
The unusually high number of overvotes found in Florida has been commented on by many! The record number of presidential candidates in Florida led to a number of awkward ballot designs that broke the list of presidential candidates into multiple columns. This is an extremely bad idea; it led voters in many counties to interpret the presidential race as two separate races, and those who voted in what appeared to be a second race had their votes counted as overvotes.
Jackson County provides a fairly typical example of a two column presidential ballot; here, 1061 of 17453 ballots, or 6.079% contained overvotes. On the Jackson County ballot, two minor presidential candidates (Phillips and Moorhead) and the blank for write-in votes occupied the second presidential column.
Full ballot image available
 Finally, there is the question of what a voter should do if he or she mismarks
a ballot. Some ballots were very explicit in their instructions, for
example, in Bay, Clay and Orange counties, the instructions said
"If you tear, deface or wrongly mark this ballot, return it and get another."
Bay and Clay counties had among the lowest overvote rates among counties
using the ES&S (formerly BRC) Optech Eagle tabulating machines, while
the rate in Orange County was noticably higher. It is noteworthy that
the instructions concerning this issue in Orange County were farther removed
from the presidential race and in a smaller typeface!
Finally, there is the question of what a voter should do if he or she mismarks
a ballot. Some ballots were very explicit in their instructions, for
example, in Bay, Clay and Orange counties, the instructions said
"If you tear, deface or wrongly mark this ballot, return it and get another."
Bay and Clay counties had among the lowest overvote rates among counties
using the ES&S (formerly BRC) Optech Eagle tabulating machines, while
the rate in Orange County was noticably higher. It is noteworthy that
the instructions concerning this issue in Orange County were farther removed
from the presidential race and in a smaller typeface!
Walton county used what may be an even more effective wording: "Do not erase or cross out, obtain a new ballot if you make an error." In contrast, the Citrus, Leon, Monroe and Polk county ballots had no instructions for voters who make errors, but the overvote rates in these counties are actually lower than those in Walton County, so it is clear that the effect of this instruction is significantly masked by other variables.
We must look at the statistics for overvotes where the voter intent could be determined to get more insight into this, but we have not yet done so.
We can summarize the lessons learned in our examination of Florida Ballots with the following simple rules ballot design:
Of course, the instructions must be specialized to each type of voting system, but to the extent possible, variations should be limited to those variations that are essential!
This suggests two things. First, when the voting system is changed, extraordinary voter education measures are appropriate. Additional posters, public demonstrations, public service commercials and similar measures should be considered part of the normal cost of adopting a new voting system.
Second, this suggests that new voting systems should not see their first use on a major election. In terms of the 4-year presidential election cycle, the ideal may be to introduce the new voting system in a local election in the first year after the presidential election, so that it is used in several local elections and primaries before it sees use in a general election, and it is used in an off-year general election before is is used in a presidential election.
The utility of an illustration can be improved if the illustrations of the marked and unmarked voting targets are placed in the same relative position to the text of the instructions as the actual voting targets have to the text of the candidate names.
the illustrations used on the Orange County ballot are an excellent example.
The Leon County ballot illustrates this well.
The format used in Hernando County is an excellent model, although the those instructions could be more complete.
The instructions used in Leon County do this well, although other elements of appropriate instructions are missing.
George W. BushWith (from Jackson County)
Dick Cheney
GEORGE W. BUSHIt is a fair guess that there would have been no need to break the list of presidential candidates into two columns on the Jackson County ballot if the redundant text had been removed from each party's slate.
for President
DICK CHENEY for Vice President
Mark sensing technology dates back as far as 19th century fax machines that could transmit faithful reproductions of messages written in non-conductive ink on tinfoil stationary; Fredrick Blakewell first demonstrated this system in 1851, and it was reduced to commercial practice on a fax line connecting Paris and Lyon in 1863. IBM's Type 805 test scoring machine, introduced in 1937, reversed this basic idea, sensing the conductive marks made by a number 2 soft lead pencil on paper, an insulator. In both the original fax application and IBM's test scoring machine, conductive brushes wiped over the surface of the stationary and the presence of a mark was detected by sensing changes in the electrical resistance of the mark.
Optical mark-sensing technology also originated in the fax machine arena, in Shelford Bidwell's scanning phototelegraph ffirst demonstrated in 1881 perfected for gray-scale transmission by Arthur Korn in 1902. E. F. Lindquist applied essentially this technology to his electronic-test scoring machine, using selenium photocells to detect changes in light transmission through paper test forms marked with number 2 soft lead pencils.
The Chatsworth optical mark reader, introduced in 1969, iopened the way to