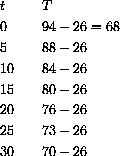
This project is to try to experimentally verify Newton's law of cooling: the rate of cooling is proportional to the difference between the object temperature and ambient temperature.
If we let T= the number of degrees Celsius above ambient and t= the time in minutes, Newton's law of cooling becomes


 C and measured the following temperature differences:
Scientists often use "semilog" plots of quantities. We want you to discover why.

 is the new variable
 . The new "semi-log" function is linear.
Where does
 appear on its graph? How would you measure k from its graph?

 versus t?
 versus t. If Newton's law of cooling is correct, what should the graph look like? How can you measure k on this graph? How would you compute the best approximation to k? How well does the students' data match Newton's law of cooling? Can you think of mistakes they may have made in their experimental procedure?
Use the program CoolHelp from our website if you wish.
You can either just look at this data question or write up a good review problem of the whole sad story of Suzie's canary. Review Problem 4.1, Exercise 4.2.1, Exercise 8.2.1, Problems 8.1, and 8.2 from the main text and write up a complete explanation of Newton's law of cooling for the canary.