Olympic Medal Standings
The PyeongChang 2018 Winter Olympics are complete and final medal counts are available.
A web site showing the medal counts
https://en.wikipedia.org/wiki/2018_Winter_Olympics_medal_table
More details are available at
https://olympics.com/en/olympic-games/pyeongchang-2018
The web site shows a table; it might be nice to show the results graphically.
The Wikipedia page (at the time of writing) contains the standings data in a form that is easy to scrape.
Using the rvest and xml2 package we can extract the table from the page:
library(rvest)
## URL <- "https://en.wikipedia.org/wiki/2018_Winter_Olympics_medal_table"
## Permanent link:
URL <- "https://en.wikipedia.org/w/index.php?title=2018_Winter_Olympics_medal_table&oldid=1062731624"
page <- read_html(URL)
page_tables <- html_table(page, fill = TRUE)
length(page_tables)
## [1] 7
mtable <- page_tables[[4]]
The table is unusually clean; only rank might need adjusting (or could be dropped), and the name of the second column needs fixing.
head(mtable)
## # A tibble: 6 × 6
## Rank .mw-parser-output .tooltip-dotted{border-bot…¹ Gold Silver Bronze Total
## <chr> <chr> <int> <int> <int> <int>
## 1 1 Norway 14 14 11 39
## 2 2 Germany 14 10 7 31
## 3 3 Canada 11 8 10 29
## 4 4 United States 9 8 6 23
## 5 5 Netherlands 8 6 6 20
## 6 6 Sweden 7 6 1 14
## # ℹ abbreviated name:
## # ¹`.mw-parser-output .tooltip-dotted{border-bottom:1px dotted;cursor:help}NOC`
str(mtable)
## tibble [31 × 6] (S3: tbl_df/tbl/data.frame)
## $ Rank : chr [1:31] "1" "2" "3" "4" ...
## $ .mw-parser-output .tooltip-dotted{border-bottom:1px dotted;cursor:help}NOC: chr [1:31] "Norway" "Germany" "Canada" "United States" ...
## $ Gold : int [1:31] 14 14 11 9 8 7 5 5 5 5 ...
## $ Silver : int [1:31] 14 10 8 8 6 6 8 6 4 3 ...
## $ Bronze : int [1:31] 11 7 10 6 6 1 4 4 6 6 ...
## $ Total : int [1:31] 39 31 29 23 20 14 17 15 15 14 ...
library(dplyr)
mtable <- mutate(mtable, Rank = as.numeric(Rank))
## Warning: There was 1 warning in `mutate()`.
## ℹ In argument: `Rank = as.numeric(Rank)`.
## Caused by warning:
## ! NAs introduced by coercion
colnames(mtable)[[2]]
## [1] ".mw-parser-output .tooltip-dotted{border-bottom:1px dotted;cursor:help}NOC"
colnames(mtable)[[2]] <- "NOC"It is also useful to drop the redundant Total variable and the total row (which had it’s Rank converted to NA):
mtable <- select(mtable, -Total)
mtable <- filter(mtable, ! is.na(Rank))
head(mtable)
## # A tibble: 6 × 5
##    Rank NOC            Gold Silver Bronze
##   <dbl> <chr>         <int>  <int>  <int>
## 1     1 Norway           14     14     11
## 2     2 Germany          14     10      7
## 3     3 Canada           11      8     10
## 4     4 United States     9      8      6
## 5     5 Netherlands       8      6      6
## 6     6 Sweden            7      6      1
A tidy form would have a variable for medal type and medal count:
library(tidyr)
mtable_tidy <- gather(mtable, medal, count, Gold : Bronze)
mtable_tidy <- pivot_longer(mtable, Gold : Bronze,
names_to = "medal",
values_to = "count")
head(mtable_tidy)
## # A tibble: 6 × 4
## Rank NOC medal count
## <dbl> <chr> <chr> <int>
## 1 1 Norway Gold 14
## 2 1 Norway Silver 14
## 3 1 Norway Bronze 11
## 4 2 Germany Gold 14
## 5 2 Germany Silver 10
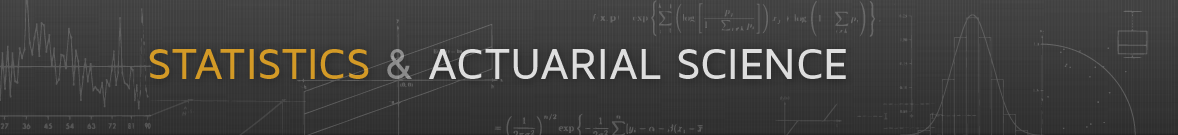
## 6 2 Germany Bronze 7A first graph:
library(ggplot2)
ggplot(mtable_tidy) +
    geom_col(aes(x = NOC, y = count, fill = medal)) +
    coord_flip()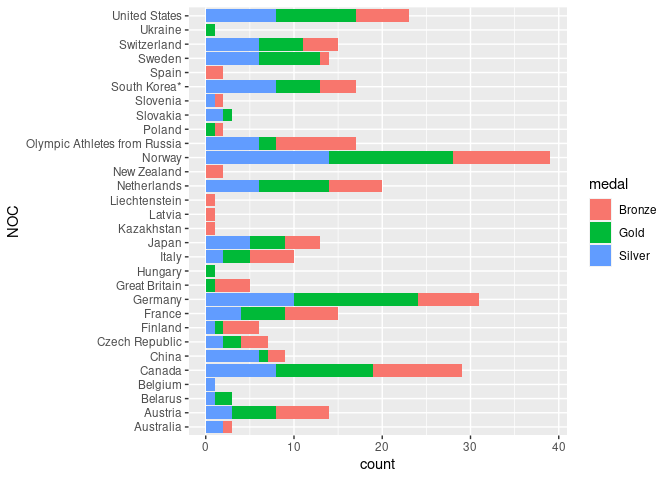
An easy way to match the country order on the web site:
ggplot(mutate(mtable_tidy, NOC = factor(NOC, rev(mtable$NOC)))) +
    geom_col(aes(x = NOC, y = count, fill = medal)) +
    coord_flip()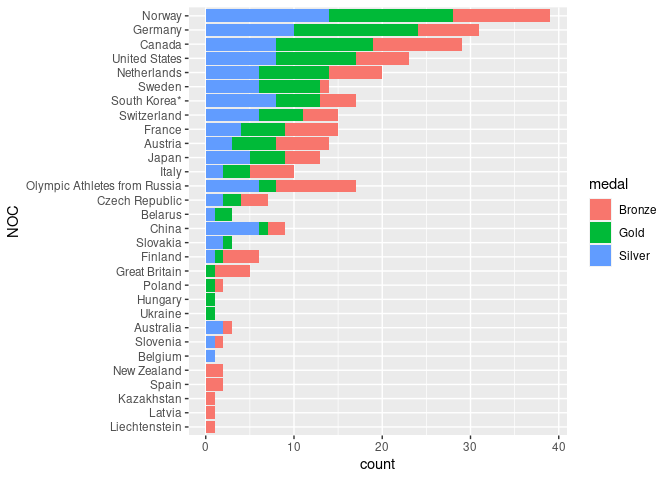
Reordering the medal type levels makes the reason for the country ordering easier to see:
p <- ggplot(mutate(mtable_tidy,
                   NOC = factor(NOC, rev(mtable$NOC)),
                   medal = factor(medal, c("Bronze", "Silver", "Gold")))) +
    geom_col(aes(x = NOC, y = count, fill = medal)) +
    coord_flip()
p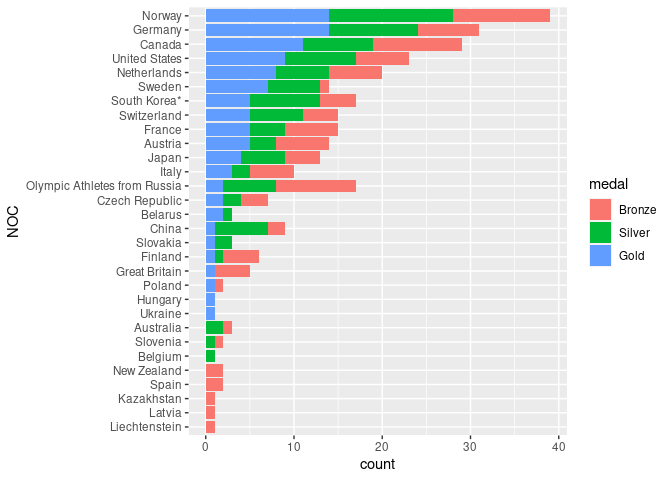
Finally, we can choose more reasonable colors. The Hex code for Bronze, for example, is from https://www.99colors.net/name/bronze:
p + scale_fill_manual(values = c("Gold" = "#D4AF37",
                                 "Silver" = "#C0C0C0",
                                 "Bronze" = "#CD7F32"))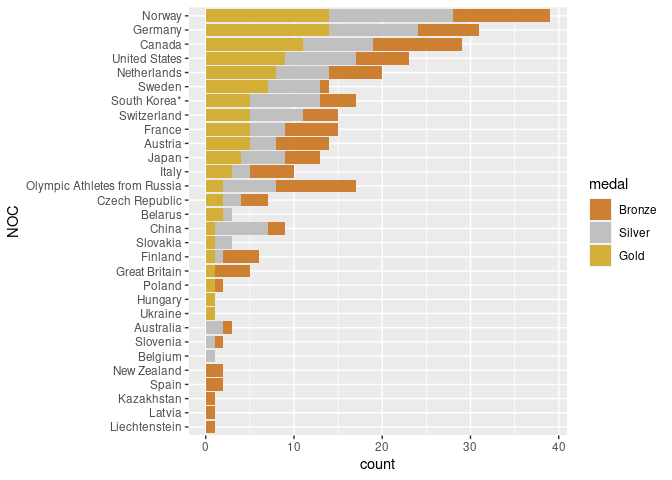
The pages on the https://olympics.com/en/ site can also be used to extract the information, but has to be assembled from the individual day results.
If this is done, the the code can be written to also obtain results for indivisual sports, for example from pages like