Vector Fields
Examples of Divergence and Curl
| > | with(plots):with(linalg):with(plottools): |
Consider the 2-dimensional vector field F = [F1, F2], where
| > | F1:=x^2*y; |
| > | F2:=3; |
| > | F:=[F1, F2]; |
| > | DivergenceOfF:=diff(F1,x)+diff(F2,y); |
| > | DrawTheField:=fieldplot(F, x=-2..2, y=-2..2, grid=[10,10], arrows=medium, fieldstrength=average): C1:=circle([0,1], .04, color=red, thickness=5): C2:=circle([1,0], .04, color=brown, thickness=5): C3:=circle([1,2], .04, color=blue, thickness=5): C4:=circle([-1,2], .04, color=green, thickness=5): |
| > | display(DrawTheField, C1, C2, C3, C4); |
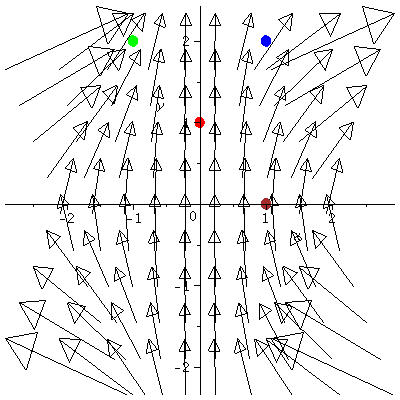 |
Note maple only shows the relative length of the arrows, not their actual lengths. For example, the arrow at (0, 1) should be the vector (0, 3) and thus its actual length is 3.
Divergence of F = ∇ · F = 2xy + 0.
Thus ∇ · F (0, 1) = 0. Thus if F represents velocity of a fluid,
the rate at which fluid is flowing into the location (0, 1) = rate at which fluid is flowing out of the location (0, 1)
∇ · F (1, 0) = 0. Thus the rate at which fluid is flowing into the location (1, 0) = rate at which fluid is flowing out of the location (1, 0)
∇ · F (1, 2) = 2 > 0. Thus the rate at which fluid is flowing into the location (1, 1) < rate at which fluid is flowing out of the location (1, 1)
∇ · F (-1, 2) = -2 > 0. Thus the rate at which fluid is flowing into the location (1, 1) > rate at which fluid is flowing out of the location (1, 1)
Read example 2, 3 in our text.
Fig 3.37, shows a vector field where ∇ · F (x, y) > 0 for all (x, y), thus at every point more fluid flows out than in.
Fig 3.38, shows a vector field where ∇ · F (x, y) < 0 for all (x, y), thus at every point more fluid flows in than out.
Figs 3.39 and 3.40 shows a vector field where ∇ · F (x, y) = 0 for all (x, y), thus at every point the amount of fluid flowing in = the amoung of fluid flowing out.
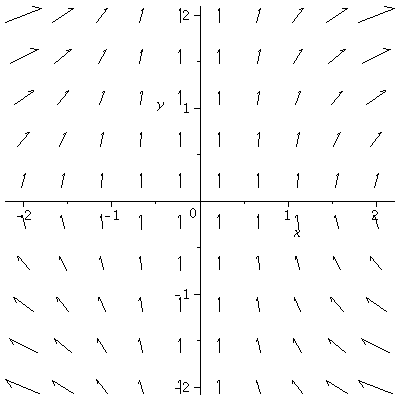
Note in the vector field above, I changed the way maple normally displays the length of the vectors by using the fieldstrength option. The following is the standard maple display of this vector field:
| > | fieldplot(F, x=-2..2, y=-2..2, grid=[10,10]); |
 |
Now let's look at some Vector Fields in R^3:
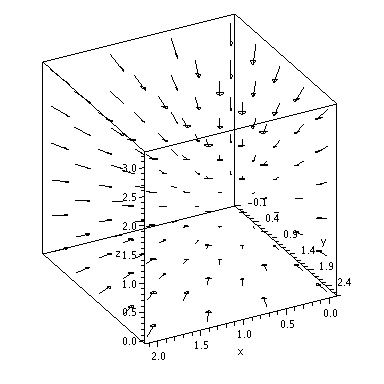
| > | F1:=x; |
| > | F2:=y; |
| > | F3:=z; |
| > | F:=[F1,F2,F3]; |
| > | fieldplot3d(F, x=0..2, y=0..2.5, z=0..3, grid=[4,5,6], color=black, axes=boxed, arrows=SLIM, orientation=[62,62]); |
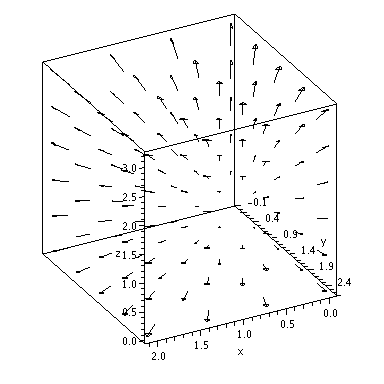 |
| > | DivergenceOfF:=diff(F1,x)+diff(F2,y)+diff(F3,z); |
Now for the curl....
There is a built-in command for curl, where we specify the vector field and the three independent variables.
| > | CurlOfF:= curl(F, [x,y,z]); |
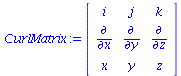
Let's re-calculate the curl vector "by hand":
| > | Del:=vector([∂/∂x, ∂/∂y, ∂/∂z]); |
| > | TopRow:=vector([i,j,k]); |
| > | BottomRow:=vector([F1,F2,F3]); |
| > | CurlMatrix:=stackmatrix(TopRow, Del, BottomRow); |
 |
Let's calculate the determinant in steps:
| > | I_component:=Diff(F3,y)-Diff(F2,z);Evaluate1:=value(%); |
| > |
| > | J_component:=-(Diff(F3,x)-Diff(F1,z));Evaluate2:=value(%); |
(Don't forget the minus sign in front of the j-component)
| > | K_component:=Diff(F2,x)-Diff(F1,y);Evaluate3:=value(%); |
| > | CurlOfF:=vector([Evaluate1, Evaluate2, Evaluate3]); |
| > | F1:=-x; |
| > | F2:=-y; |
| > | F3:=-z; |
| > | F:=[F1,F2,F3]; |
| > | fieldplot3d(F, x=0..2, y=0..2.5, z=0..3, grid=[4,5,6], color=black, axes=boxed, arrows=SLIM, orientation=[62,62]); |
 |
| > | DivergenceOfF:=diff(F1,x)+diff(F2,y)+diff(F3,z); |
| > | CurlOfF:= curl(F, [x,y,z]); |
| > | F1:=-y; |
| > | F2:=x; |
| > | F3:=0; |
| > | F:=[F1,F2,F3]; |
| > | fieldplot3d(F, x=-2..2, y=-2.5..2.5, z=-3..3, grid=[4,5,6], color=black, axes=boxed, arrows=SLIM, orientation=[62,62]); |
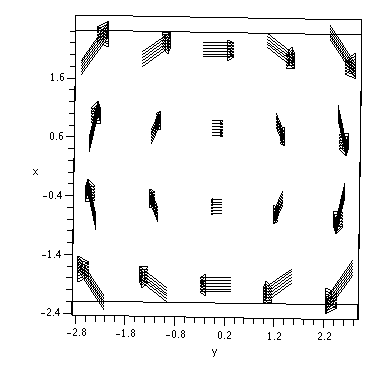 |
| > | DivergenceOfF:=diff(F1,x)+diff(F2,y)+diff(F3,z); |
| > | CurlOfF:= curl(F, [x,y,z]); |